See what is happening inside your heating system
Together with Atomika · real-time data · clear results
Energy shows usage, cost and invoices. Atomika shows what is happening inside the heating system — and Laufið's anomaly system connects the two and alerts the right people.
Contact usShows usage, cost and invoices for the building.
Shows what is happening in the heating system — flow, temperature and how well the hot water is used.
Connects the data, detects anomalies and alerts the right people.
This is what the ATOMIKA analysis looks like in Laufið
The heating system's key metrics, status and anomalies appear in one place — together with a usage overview for the selected period.
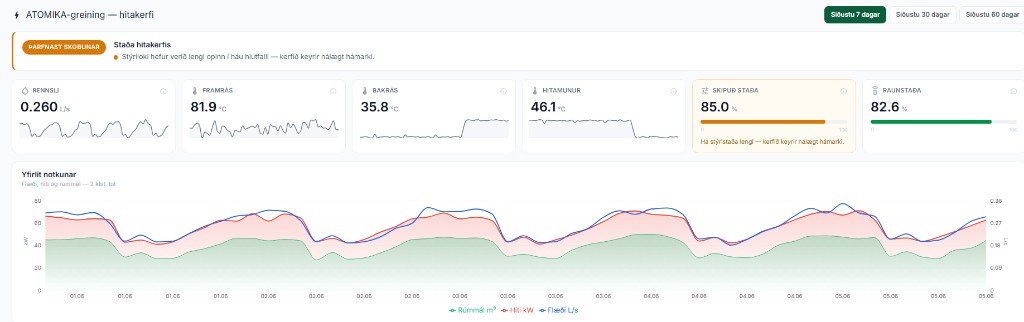
ATOMIKA analysis in the Laufið dashboard (demo data).
Heating-system metrics in plain language
Atomika reads flow, supply, return, temperature difference and heat load. Laufið translates the technical data into a clear status — green, yellow or red — so you instantly see whether the system uses the hot water well.
The anomaly system alerts the right people
When the data suggests inefficiency — e.g. a high return temperature or a low temperature difference — Laufið creates an anomaly with an explanation and a recommended action. Notifications arrive in-app, by email or SMS, including to external contacts such as service providers.
Want to see Atomika in Laufið?
We'll show you how the Atomika analysis and the anomaly system work together in your building's operations.
Contact us